Note
Go to the end to download the full example code
EDB: plot nets with Matplotlib#
This example shows how you can use the Edb class to plot a net or a layout.
Perform required imports#
Perform required imports, which includes importing a section.
import os
import pyaedt
Download file#
Download the AEDT file and copy it into the temporary folder.
temp_folder = pyaedt.generate_unique_folder_name()

targetfolder = pyaedt.downloads.download_file('edb/ANSYS-HSD_V1.aedb', destination=temp_folder)
Launch EDB#
Launch the pyaedt.Edb class, using EDB 2023 R2 and SI units.
edb = pyaedt.Edb(edbpath=targetfolder, edbversion="2023.2")
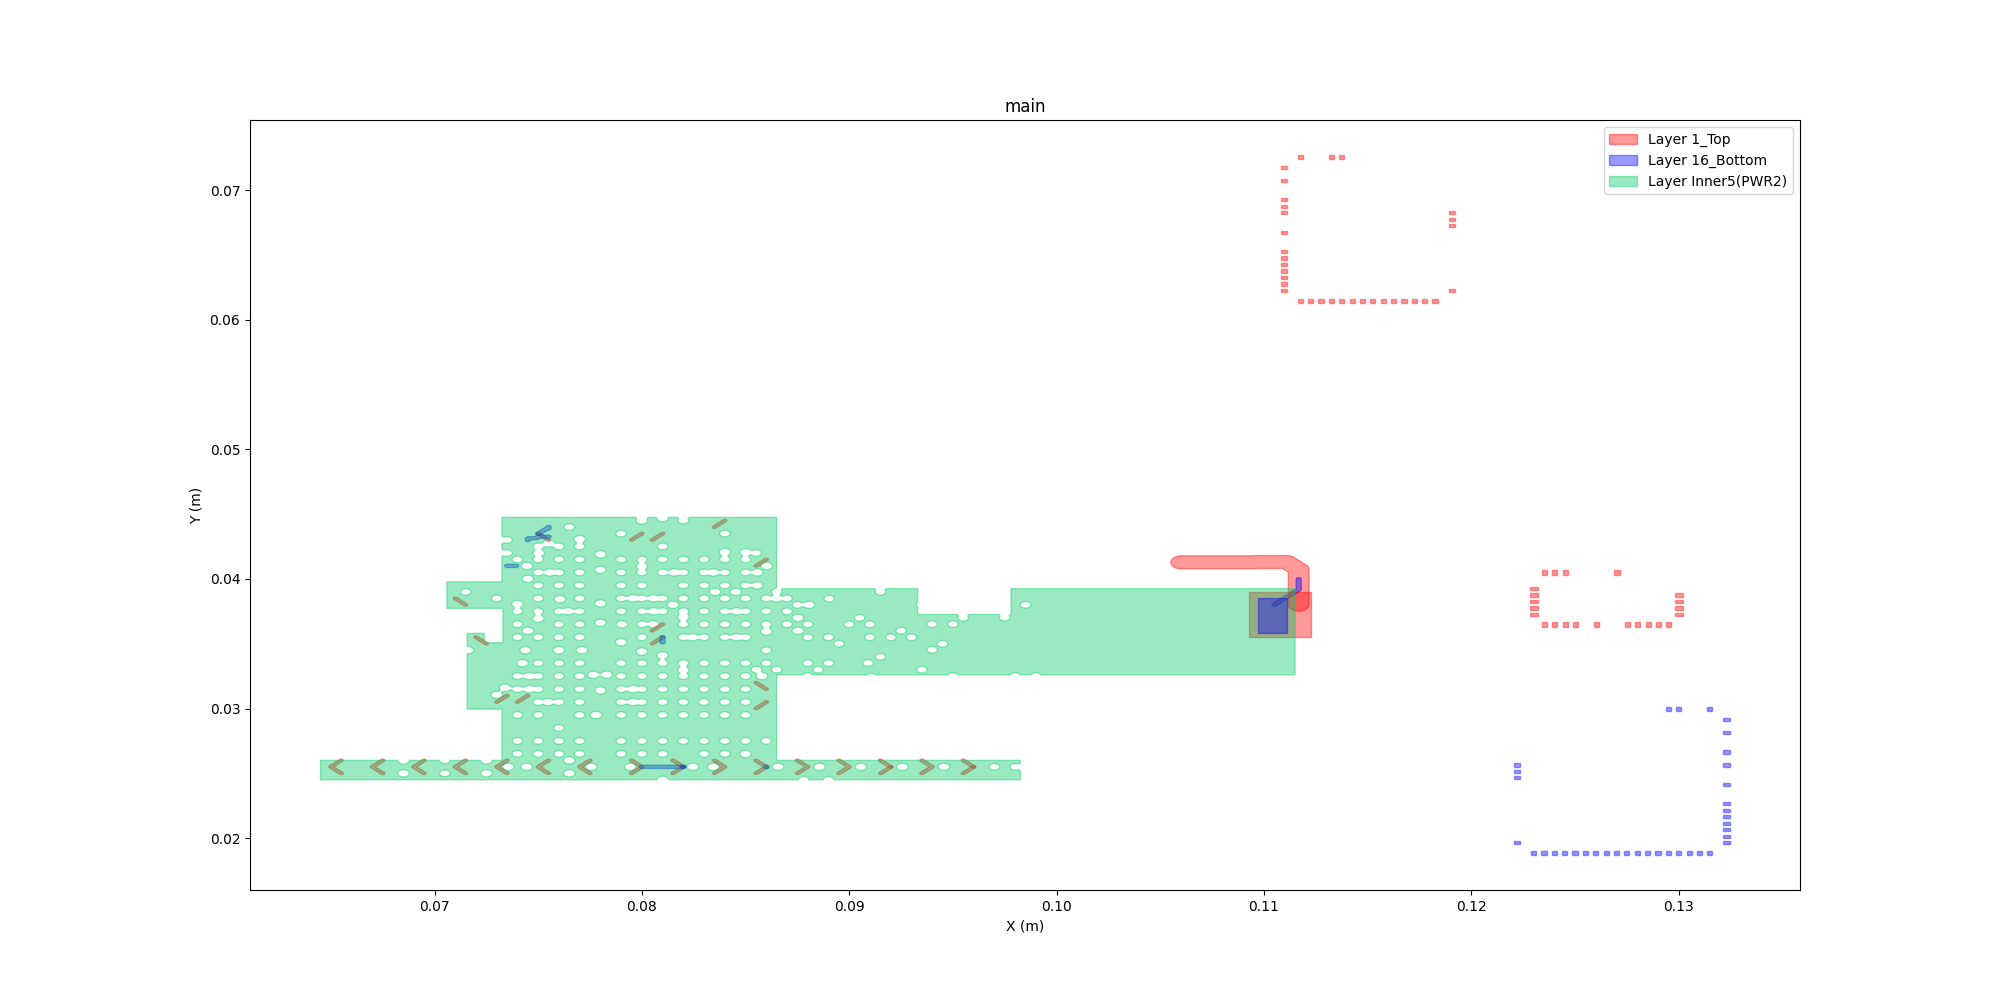
Plot custom set of nets colored by layer#
Plot a custom set of nets colored by layer (default).
edb.nets.plot("AVCC_1V3")
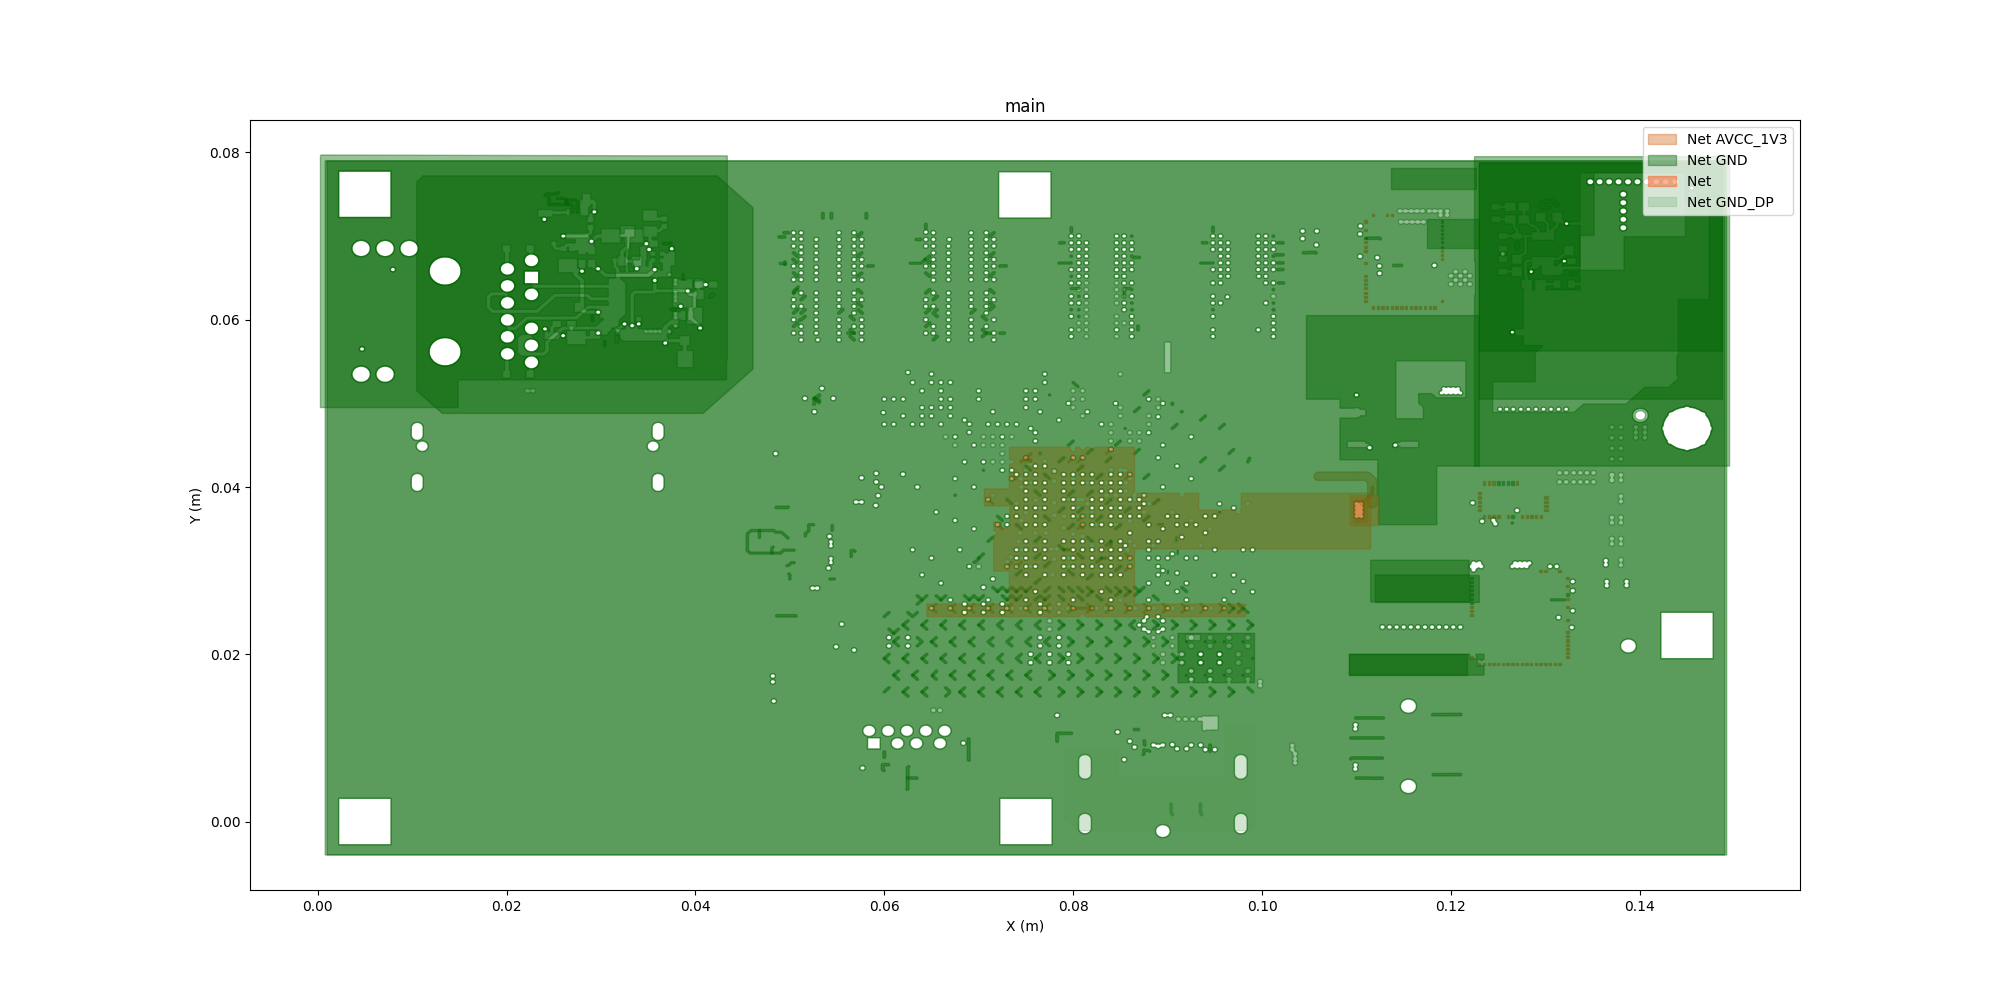
Plot custom set of nets colored by nets#
Plot a custom set of nets colored by nets.
edb.nets.plot(["GND", "GND_DP", "AVCC_1V3"], color_by_net=True)
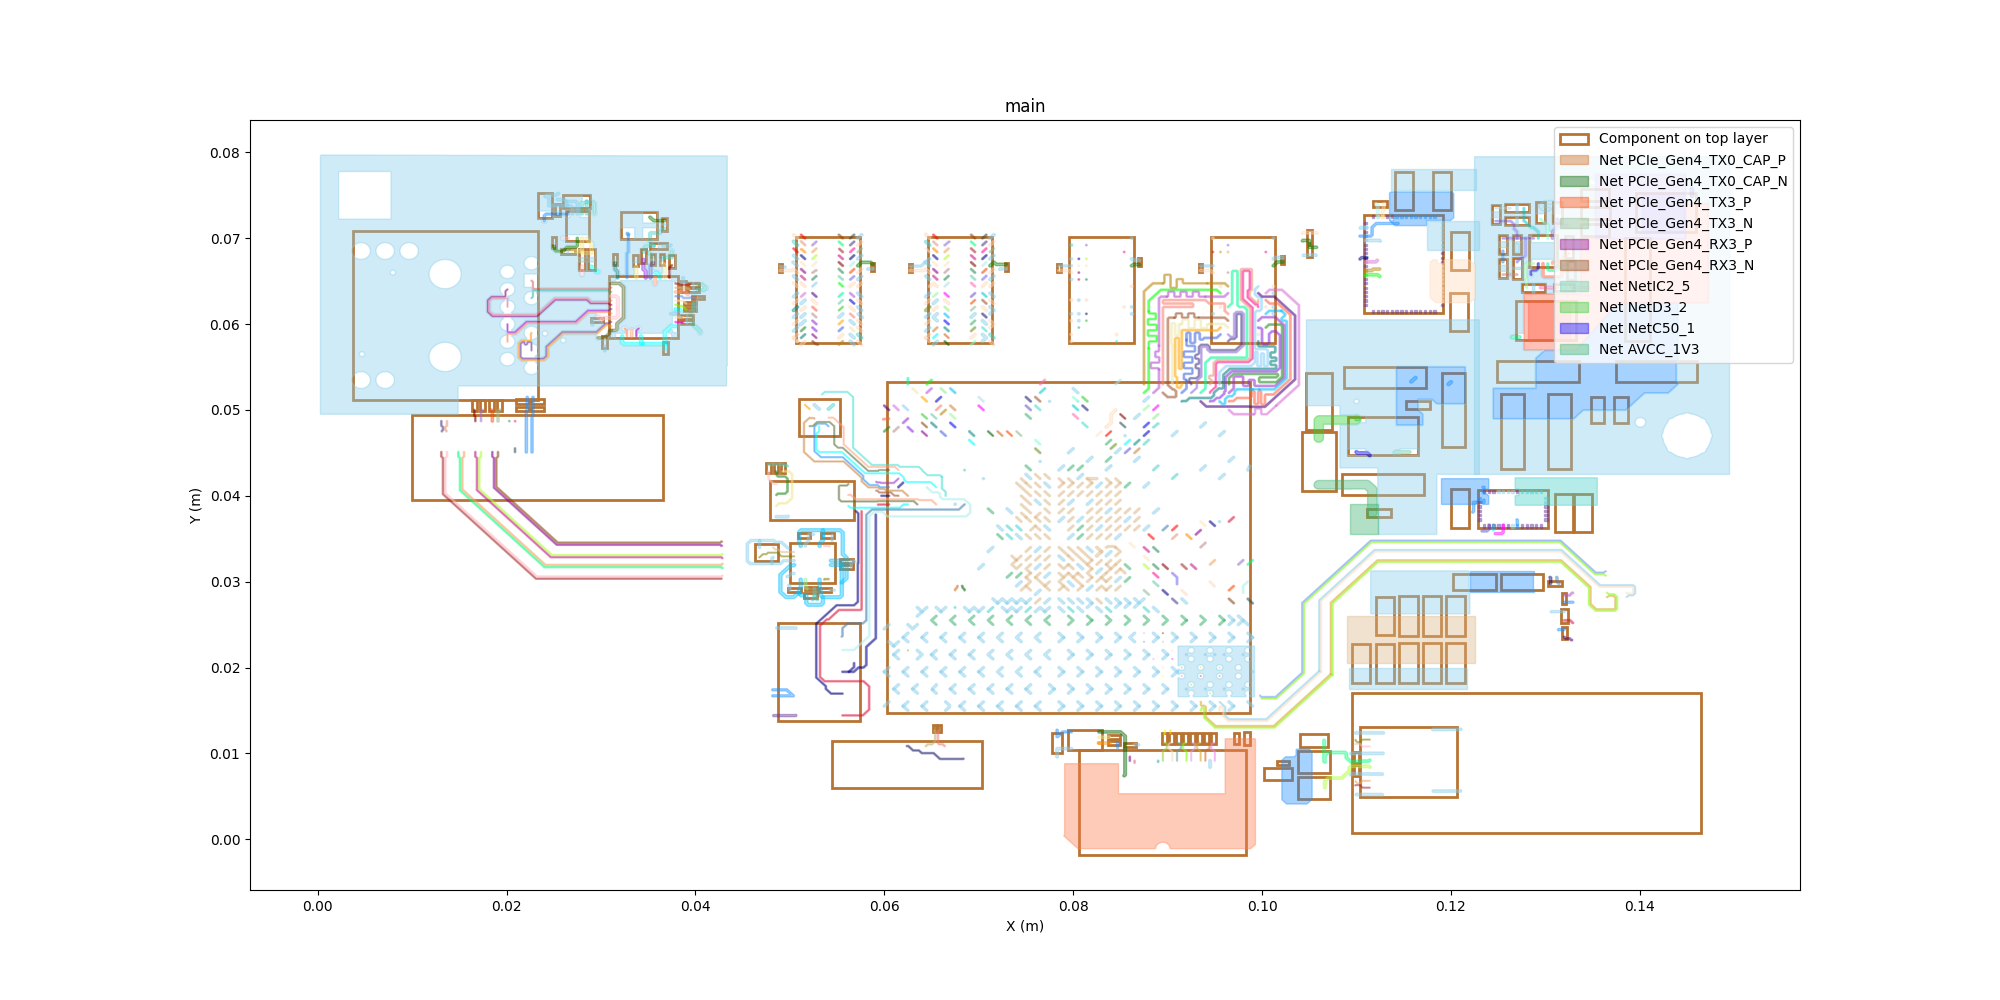
Plot all nets on a layer colored by nets#
Plot all nets on a layer colored by nets
edb.nets.plot(None, ["1_Top"], color_by_net=True, plot_components_on_top=True)
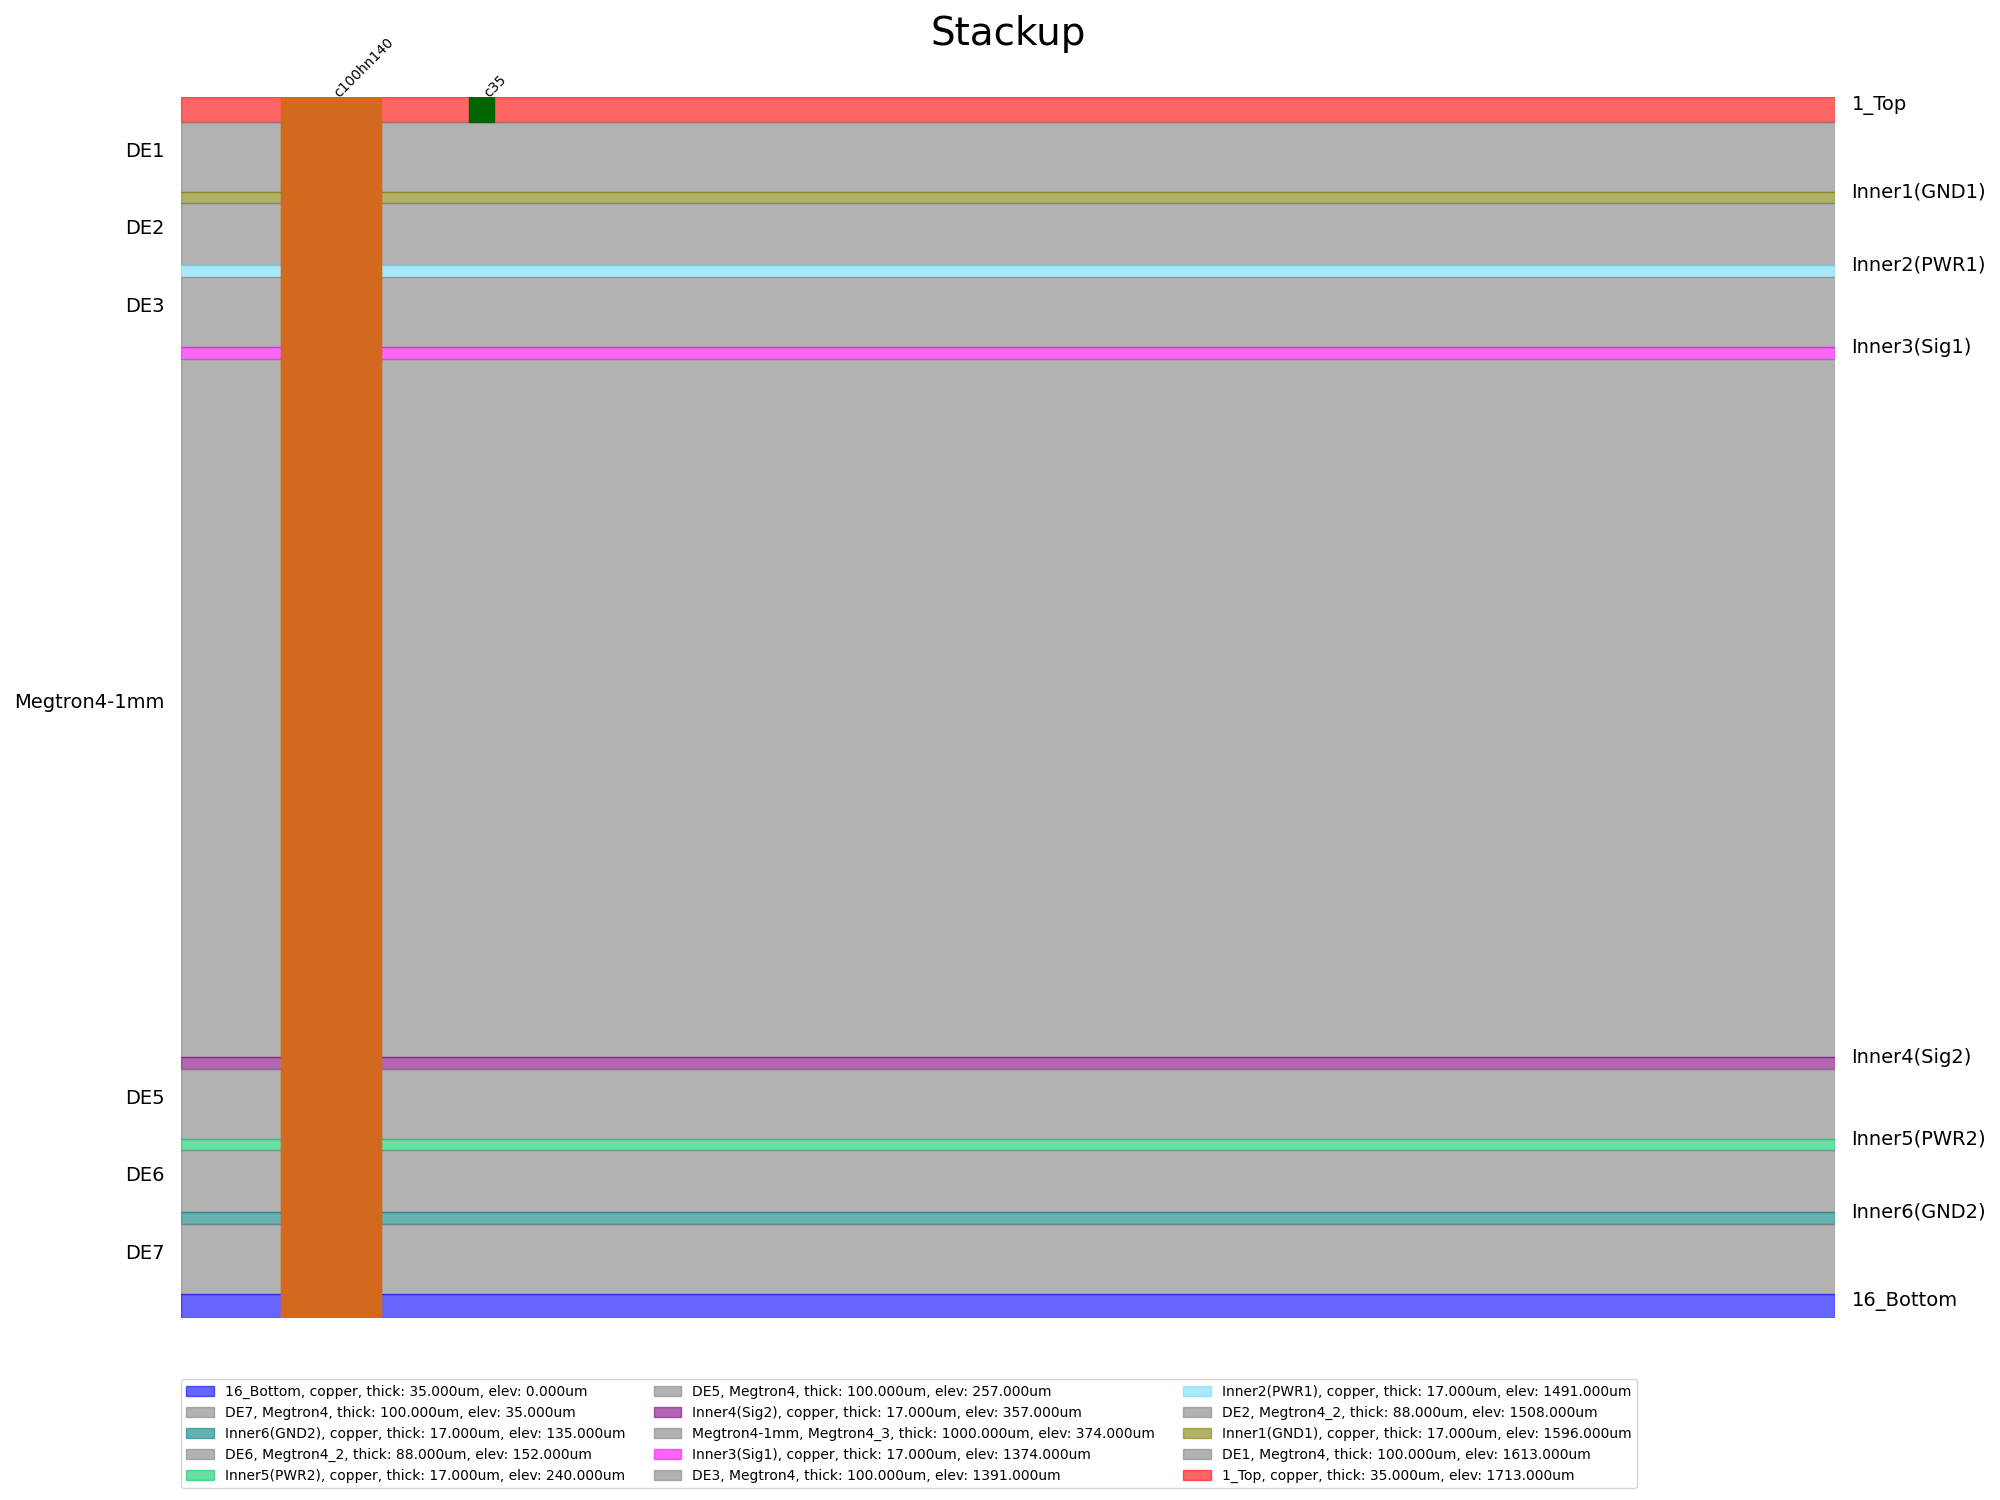
Plot stackup and some padstack definition#
Plot all nets on a layer colored by nets
edb.stackup.plot(scale_elevation=False,plot_definitions=["c100hn140", "c35"])
<module 'matplotlib.pyplot' from 'C:\\actions-runner\\_work\\pyaedt\\pyaedt\\testenv\\lib\\site-packages\\matplotlib\\pyplot.py'>
Close EDB#
Close EDB.
edb.close_edb()
True
Total running time of the script: (0 minutes 15.369 seconds)