Note
Go to the end to download the full example code
HFSS: Inductive Iris waveguide filter#
This example shows how to build and analyze a 4-pole X-Band waveguide filter using inductive irises.
# sphinx_gallery_thumbnail_path = 'Resources/wgf.png'
Perform required imports#
Perform required imports.
import os
import tempfile
import pyaedt
from pyaedt import general_methods
Launch Ansys Electronics Desktop (AEDT)#
Define parameters and values for waveguide iris filter#
- l: Length of the cavity from the mid-point of one iris
to the midpoint of the next iris.
w: Width of the iris opening. a: Long dimension of the waveguide cross-section (X-Band) b: Short dimension of the waveguide cross-section. t: Metal thickness of the iris insert.
wgparams = {'l': [0.7428, 0.82188],
            'w': [0.50013, 0.3642, 0.3458],
            'a': 0.4,
            'b': 0.9,
            't': 0.15,
            'units': 'in'}

non_graphical = False
new_thread = True
Save the project and results in the TEMP folder#
project_folder = os.path.join(tempfile.gettempdir(), "waveguide_example")
if not os.path.exists(project_folder):
    os.mkdir(project_folder)
project_name = os.path.join(project_folder, general_methods.generate_unique_name("wgf", n=2))

# Instantiate the HFSS application
hfss = pyaedt.Hfss(projectname=project_name + '.aedt',
                   specified_version="2023.2",
                   designname="filter",
                   non_graphical=non_graphical,
                   new_desktop_session=True,
                   close_on_exit=True)

# hfss.settings.enable_debug_methods_argument_logger = False  # Only for debugging.

var_mapping = dict()  # Used by parse_expr to parse expressions.
Initializing new desktop!
Initialize design parameters in HFSS.#
hfss.modeler.model_units = "in"  # Set to inches
for key in wgparams:
    if type(wgparams[key]) in [int, float]:
        hfss[key] = str(wgparams[key]) + wgparams['units']
        var_mapping[key] = wgparams[key]  # Used for expression parsing
    elif type(wgparams[key]) == list:
        count = 1
        for v in wgparams[key]:
            this_key = key + str(count)
            hfss[this_key] = str(v) + wgparams['units']
            var_mapping[this_key] = v  # Used to parse expressions and generate numerical values.
            count += 1

if len(wgparams['l']) % 2 == 0:
    zstart = "-t/2"  # Even number of cavities, odd number of irises.
    is_even = True
else:
    zstart = "l1/2 - t/2"  # Odd number of cavities, even number of irises.
    is_even = False
Draw parametric waveguide filter#
Define a function to place each iris at the correct longitudinal (z) position, Loop from the largest index (interior of the filter) to 1, which is the first iris nearest the waveguide ports.
def place_iris(zpos, dz, n):
    w_str = "w" + str(n)  # Iris width parameter as a string.
    this_name = "iris_a_"+str(n)  # Iris object name in the HFSS project.
    iris = []  # Return a list of the two objects that make up the iris.
    if this_name in hfss.modeler.object_names:
        this_name = this_name.replace("a", "c")
    iris.append(hfss.modeler.create_box(['-b/2', '-a/2', zpos], ['(b - ' + w_str + ')/2', 'a',  dz],
                                                    name=this_name, matname="silver"))
    iris.append(iris[0].mirror([0, 0, 0], [1, 0, 0], duplicate=True))
    return iris
Place irises#
Place the irises from inner (highest integer) to outer.
for count in reversed(range(1, len(wgparams['w']) + 1)):
    if count < len(wgparams['w']):  # Update zpos
        zpos = zpos + "".join([" + l" + str(count) + " + "])[:-3]
        iris = place_iris(zpos, "t", count)
        iris = place_iris("-(" + zpos + ")", "-t", count)

    else:  # Place first iris
        zpos = zstart
        iris = place_iris(zpos, "t", count)
        if not is_even:
            iris = place_iris("-(" + zpos + ")", "-t", count)
Draw full waveguide with ports#
Use hfss.variable_manager which acts like a dict() to return an instance of
the pyaedt.application.Variables.VariableManager class for any variable.
The VariableManager instance takes the HFSS variable name as a key.
VariableManager properties enable access to update, modify and
evaluate variables.
var_mapping['port_extension'] = 1.5 * wgparams['l'][0]
hfss['port_extension'] = str(var_mapping['port_extension']) + wgparams['units']
hfss["wg_z_start"] = "-(" + zpos + ") - port_extension"
hfss["wg_length"] = "2*(" + zpos + " + port_extension )"
wg_z_start = hfss.variable_manager["wg_z_start"]
wg_length = hfss.variable_manager["wg_length"]
hfss["u_start"] = "-a/2"
hfss["u_end"] = "a/2"
hfss.modeler.create_box(["-b/2", "-a/2", "wg_z_start"], ["b", "a", "wg_length"],
                        name="waveguide", matname="vacuum")
<pyaedt.modeler.cad.object3d.Object3d object at 0x000001D983AC1930>
Draw the whole waveguide.#
wg_z is the total length of the waveguide, including port extension.
Note that the .evaluated_value provides access to the numerical value of
wg_z_start which is an expression in HFSS.
wg_z = [wg_z_start.evaluated_value, hfss.value_with_units(wg_z_start.numeric_value + wg_length.numeric_value, "in")]
Assign wave ports to the end faces of the waveguid and define the calibration lines to ensure self-consistent polarization between wave ports. ~~~~~~~~~~~~~~~~~~~~~~~~~~~~~~
count = 0
ports = []
for n, z in enumerate(wg_z):
    face_id = hfss.modeler.get_faceid_from_position([0, 0, z], obj_name="waveguide")
    u_start = [0, hfss.variable_manager["u_start"].evaluated_value,  z]
    u_end = [0, hfss.variable_manager["u_end"].evaluated_value, z]

    ports.append(hfss.wave_port(face_id, integration_line=[u_start, u_end], name="P" + str(n + 1), renormalize=False))
Insert the mesh adaptation setup using refinement at two frequencies.#
This approach is useful for resonant structures as the coarse initial mesh impacts the resonant frequency and hence, the field propagation through the filter. Adaptation at multiple frequencies helps to ensure that energy propagates through the resonant structure while the mesh is refined.
setup = hfss.create_setup("Setup1", setuptype="HFSSDriven",
                           MultipleAdaptiveFreqsSetup=['9.8GHz', '10.2GHz'],
                           MaximumPasses=5)

setup.create_frequency_sweep(
    unit="GHz",
    sweepname="Sweep1",
    freqstart=9.5,
    freqstop=10.5,
    sweep_type="Interpolating",
    )
<pyaedt.modules.SolveSweeps.SweepHFSS object at 0x000001D983AC1750>
Solve the project with two tasks. Each frequency point is solved simultaneously.
setup.analyze(num_tasks=2)
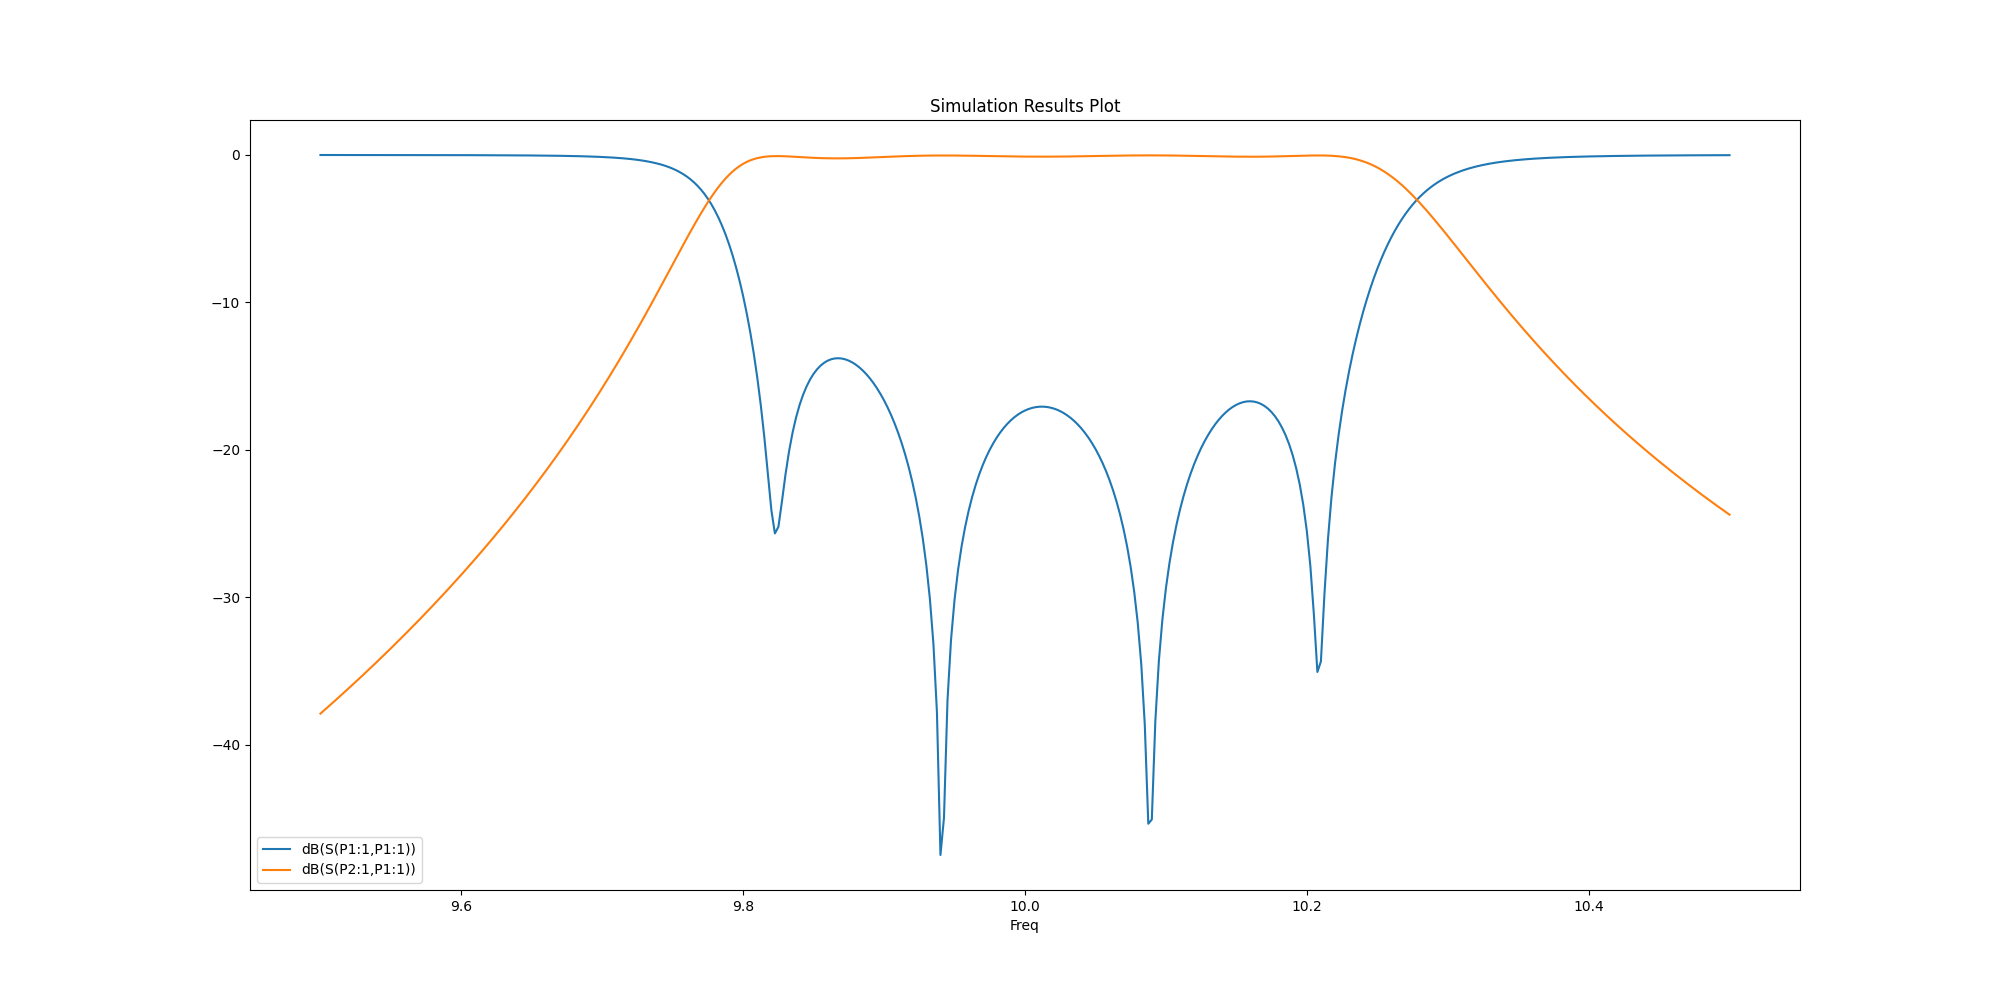
- Generate S-Parameter Plots
Caution: The syntax for expressions must be identical to that used in HFSS.
traces_to_plot = hfss.get_traces_for_plot(second_element_filter="P1*")
report = hfss.post.create_report(traces_to_plot)  # Creates a report in HFSS
solution = report.get_solution_data()
plt = solution.plot(solution.expressions)  # Matplotlib axes object.

hfss.save_project()
hfss.release_desktop()

True
Total running time of the script: (1 minutes 53.553 seconds)