Note
Go to the end to download the full example code
Circuit: transient analysis and eye plot#
This example shows how you can use PyAEDT to create a circuit design, run a Nexxim time-domain simulation, and create an eye diagram.
Perform required imports#
Perform required imports.
import os
from matplotlib import pyplot as plt
import numpy as np
import pyaedt
Set non-graphical mode#
Set non-graphical mode, "PYAEDT_NON_GRAPHICAL" is needed to generate
documentation only.
You can set non_graphical either to True or False.
non_graphical = False
Launch AEDT with Circuit#
Launch AEDT 2023 R2 in graphical mode with Circuit.
cir = pyaedt.Circuit(projectname=pyaedt.generate_unique_project_name(),
                     specified_version="2023.2",
                     new_desktop_session=True,
                     non_graphical=non_graphical
                     )
Initializing new desktop!
Read IBIS file#
Read an IBIS file and place a buffer in the schematic.
ibis = cir.get_ibis_model_from_file(os.path.join(cir.desktop_install_dir, 'buflib', 'IBIS', 'u26a_800.ibs'))
ibs = ibis.buffers["DQ_u26a_800"].insert(0, 0)
Place ideal transmission line#
Place an ideal transmission line in the schematic and parametrize it.
tr1 = cir.modeler.components.components_catalog["Ideal Distributed:TRLK_NX"].place("tr1")
tr1.parameters["P"] = "50mm"
Create resistor and ground#
Create a resistor and ground in the schematic.
res = cir.modeler.components.create_resistor(compname="R1", value="1Meg")
gnd1 = cir.modeler.components.create_gnd()
Connect elements#
Connect elements in the schematic.
tr1.pins[0].connect_to_component(ibs.pins[0])
tr1.pins[1].connect_to_component(res.pins[0])
res.pins[1].connect_to_component(gnd1.pins[0])
True
Place probe#
Place a probe and rename it to Vout.
pr1 = cir.modeler.components.components_catalog["Probes:VPROBE"].place("vout")
pr1.parameters["Name"] = "Vout"
pr1.pins[0].connect_to_component(res.pins[0])
pr2 = cir.modeler.components.components_catalog["Probes:VPROBE"].place("Vin")
pr2.parameters["Name"] = "Vin"
pr2.pins[0].connect_to_component(ibs.pins[0])
True
Create setup and analyze#
Create a transient analysis setup and analyze it.
trans_setup = cir.create_setup(setupname="TransientRun", setuptype="NexximTransient")
trans_setup.props["TransientData"] = ["0.01ns", "200ns"]
cir.analyze_setup("TransientRun")
True
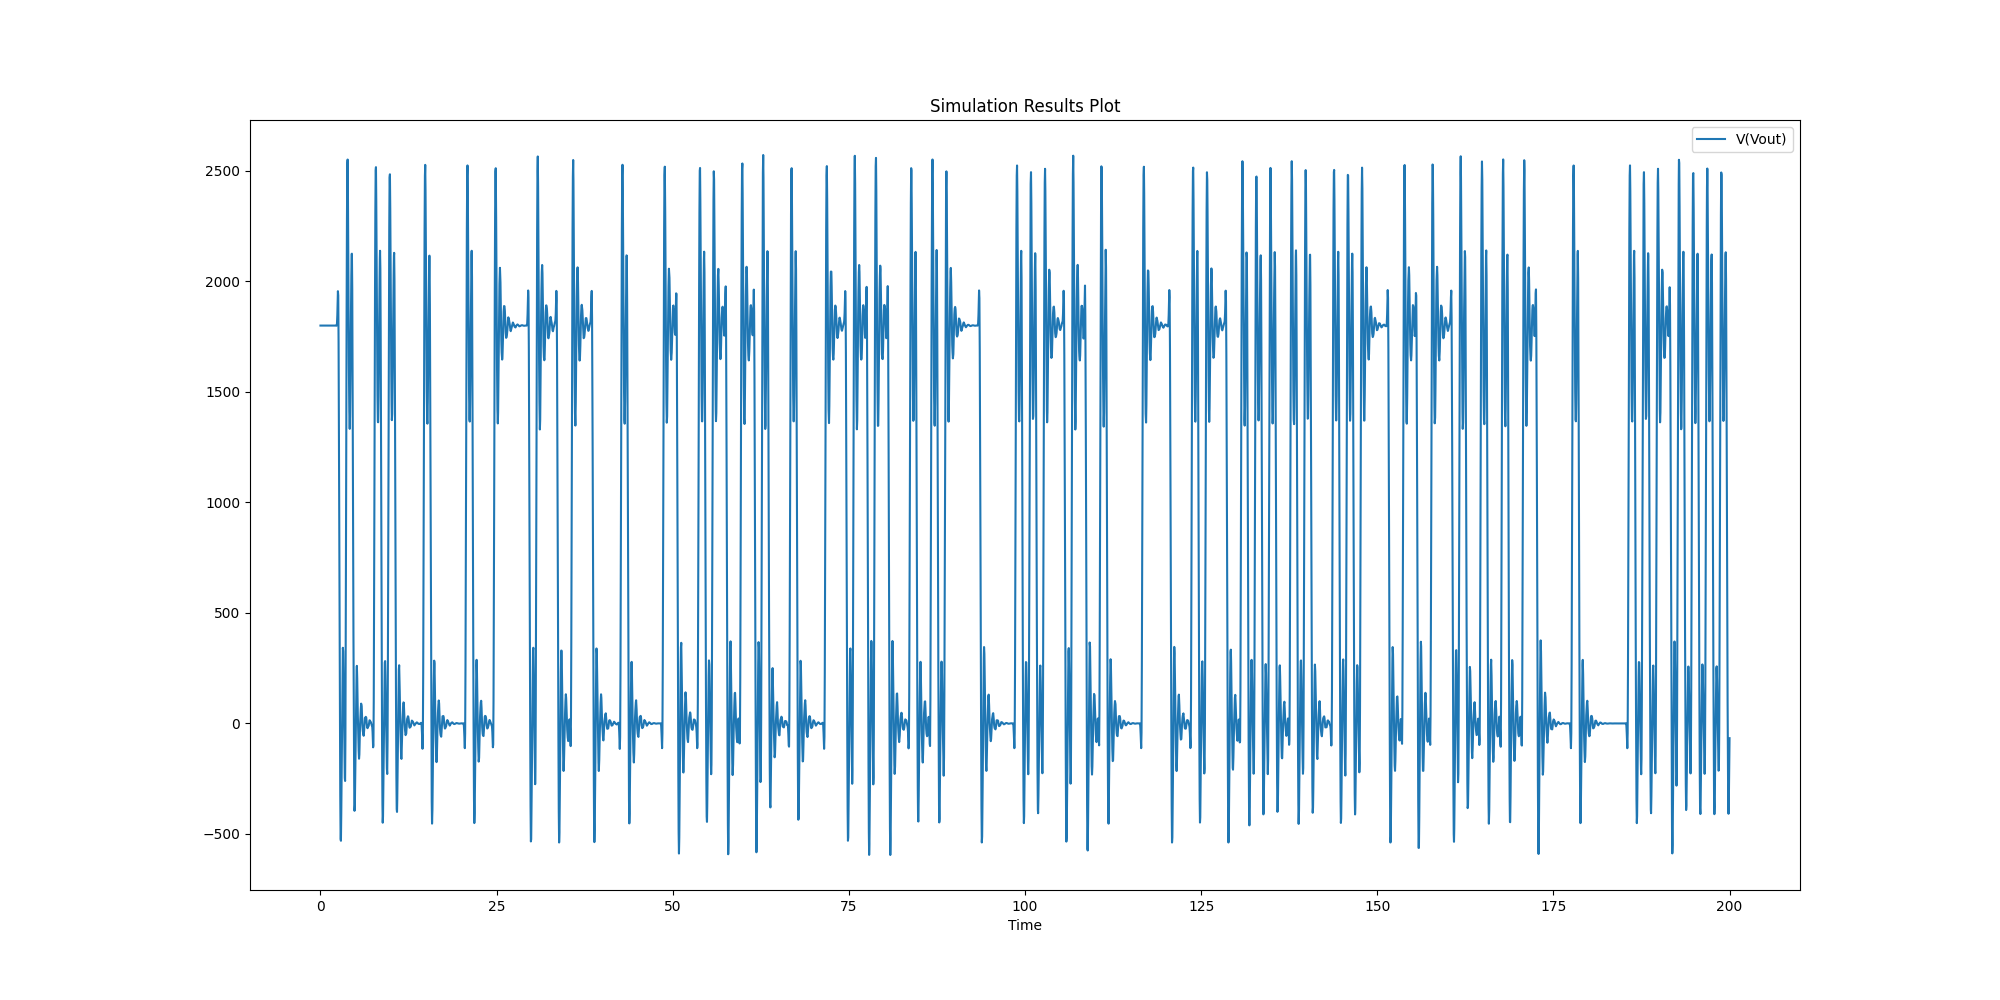
Create report outside AEDT#
Create a report outside AEDT using the get_solution_data method. This
method allows you to get solution data and plot it outside AEDT without needing
a UI.
report = cir.post.create_report("V(Vout)", domain="Time")
if not non_graphical:
    report.add_cartesian_y_marker(0)
solutions = cir.post.get_solution_data(domain="Time")
solutions.plot("V(Vout)")
<Figure size 2000x1000 with 1 Axes>
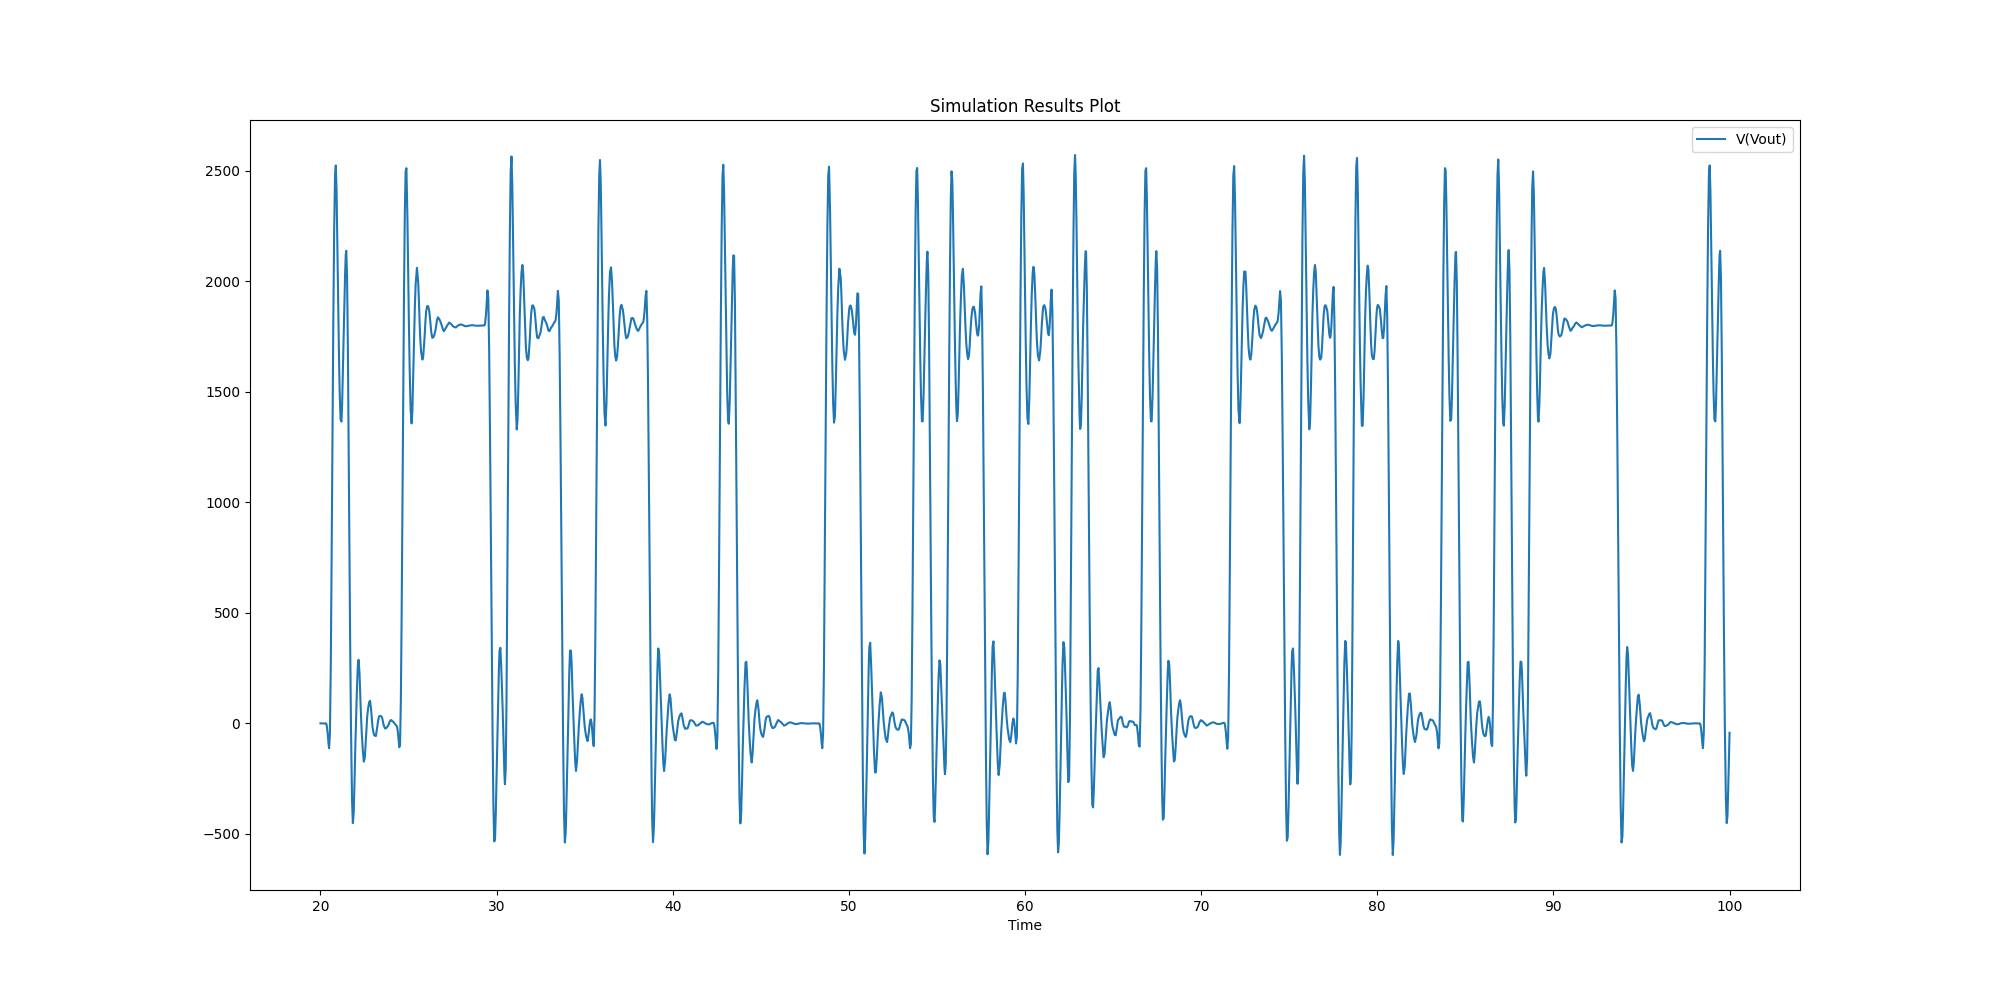
Create report inside AEDT#
Create a report inside AEDT using the new_report object. This object is
fully customizable and usable with most of the reports available in AEDT.
The standard report is the main one used in Circuit and Twin Builder.
new_report = cir.post.reports_by_category.standard("V(Vout)")
new_report.domain = "Time"
new_report.create()
if not non_graphical:
    new_report.add_limit_line_from_points([60, 80], [1, 1], "ns", "V")
    vout = new_report.traces[0]
    vout.set_trace_properties(trace_style=vout.LINESTYLE.Dot, width=2, trace_type=vout.TRACETYPE.Continuous,
                              color=(0, 0, 255))
    vout.set_symbol_properties(style=vout.SYMBOLSTYLE.Circle, fill=True, color=(255, 255, 0))
    ll = new_report.limit_lines[0]
    ll.set_line_properties(style=ll.LINESTYLE.Solid, width=4, hatch_above=True, violation_emphasis=True, hatch_pixels=2,
                           color=(0, 0, 255))
new_report.time_start = "20ns"
new_report.time_stop = "100ns"
new_report.create()
sol = new_report.get_solution_data()
sol.plot()
<Figure size 2000x1000 with 1 Axes>
Create eye diagram inside AEDT#
Create an eye diagram inside AEDT using the new_eye object.
new_eye = cir.post.reports_by_category.eye_diagram("V(Vout)")
new_eye.unit_interval = "1e-9s"
new_eye.time_stop = "100ns"
new_eye.create()
True
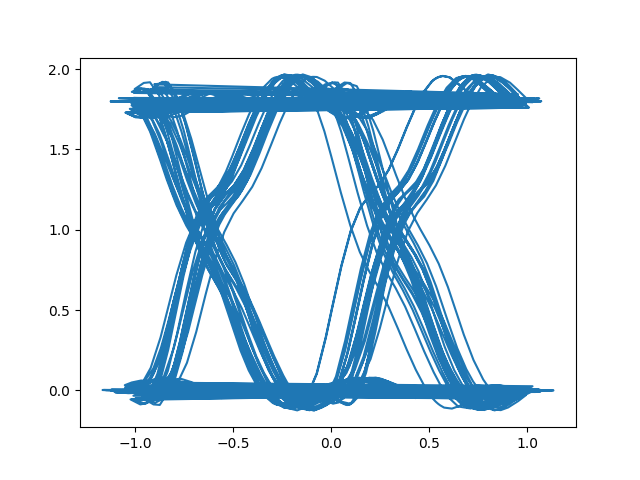
Create eye diagram outside AEDT#
Create the same eye diagram outside AEDT using Matplotlib and the
get_solution_data method.
unit_interval = 1
offset = 0.25
tstop = 200
tstart = 0
t_steps = []
i = tstart + offset
while i < tstop:
    i += 2 * unit_interval
    t_steps.append(i)

t = [[i for i in solutions.intrinsics["Time"] if k - 2 * unit_interval < i <= k] for k in
     t_steps]
ys = [[i / 1000 for i, j in zip(solutions.data_real(), solutions.intrinsics["Time"]) if
       k - 2 * unit_interval < j <= k] for k in t_steps]
fig, ax = plt.subplots(sharex=True)
cellst = np.array([])
cellsv = np.array([])
for a, b in zip(t, ys):
    an = np.array(a)
    an = an - an.mean()
    bn = np.array(b)
    cellst = np.append(cellst, an)
    cellsv = np.append(cellsv, bn)
plt.plot(cellst.T,  cellsv.T, zorder=0)
plt.show()
Release AEDT#
Release AEDT.
cir.save_project()
cir.release_desktop()
True
Total running time of the script: (1 minutes 2.301 seconds)