EMI heat map#
The EMI heat map extension allows users to generate a 2D heat map of EMI results between two radio bands.
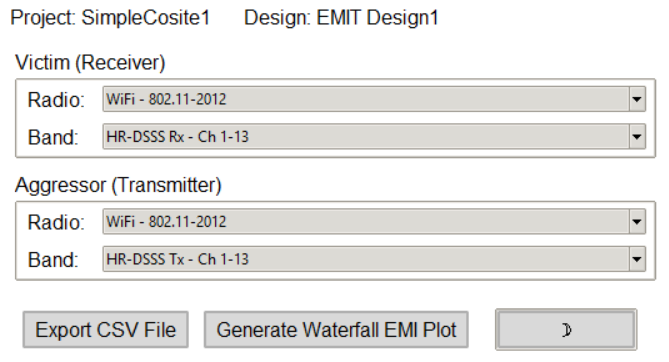
The extension provides a Graphical User Interface (GUI) for configuration.
The following image shows the extension GUI:
Features#
View EMI results as a 2D heat map between two selected radio bands.
Export formatted results to Excel.
Switch between light and dark themes in the GUI.
Using the extension#
Open the Automation tab in the EMIT interface.
Locate and click the EMI heat map icon under the Extension Manager.
In the GUI, users can select the tx/rx radio bands to compare using the dropdown menus.
Use the buttons at the bottom to: - Generate the results matrix - Export results to Excel